Our Next Generation MMRV Solution
The greatest barriers to generating carbon removal credits on croplands have been the low accuracy and affordability of the Measuring, Monitoring, Reporting and Verification (MRV) systems used to measure change in soil carbon at the field level. Low accuracy makes it hard for CDR credit buyers to be confident they will get the carbon removal they are seeking. High cost reduces the credit revenue available to farmers. We remove those barriers.
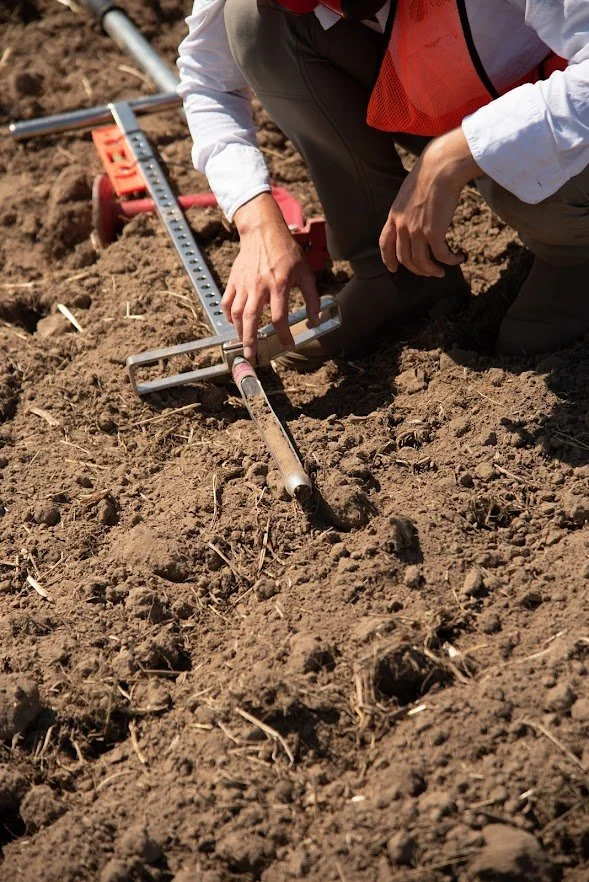
Today carbon farming projects use a “measure and model” method to quantify the amount of carbon removal for the entire project. Soil testing is very expensive, so they sample a small percentage of acres at a low sample density. They add predictions from decades-old “process-based” models calibrated with small amounts of often outdated field data. Neither the field sampling nor modeling tools used today produce accurate assessments of the carbon stock in the soil, so carbon farming project developers are required to take a large “uncertainty deduction” to give buyers confidence they will get the carbon removal they purchase. That deduction represents the largest cost of a carbon farming project.
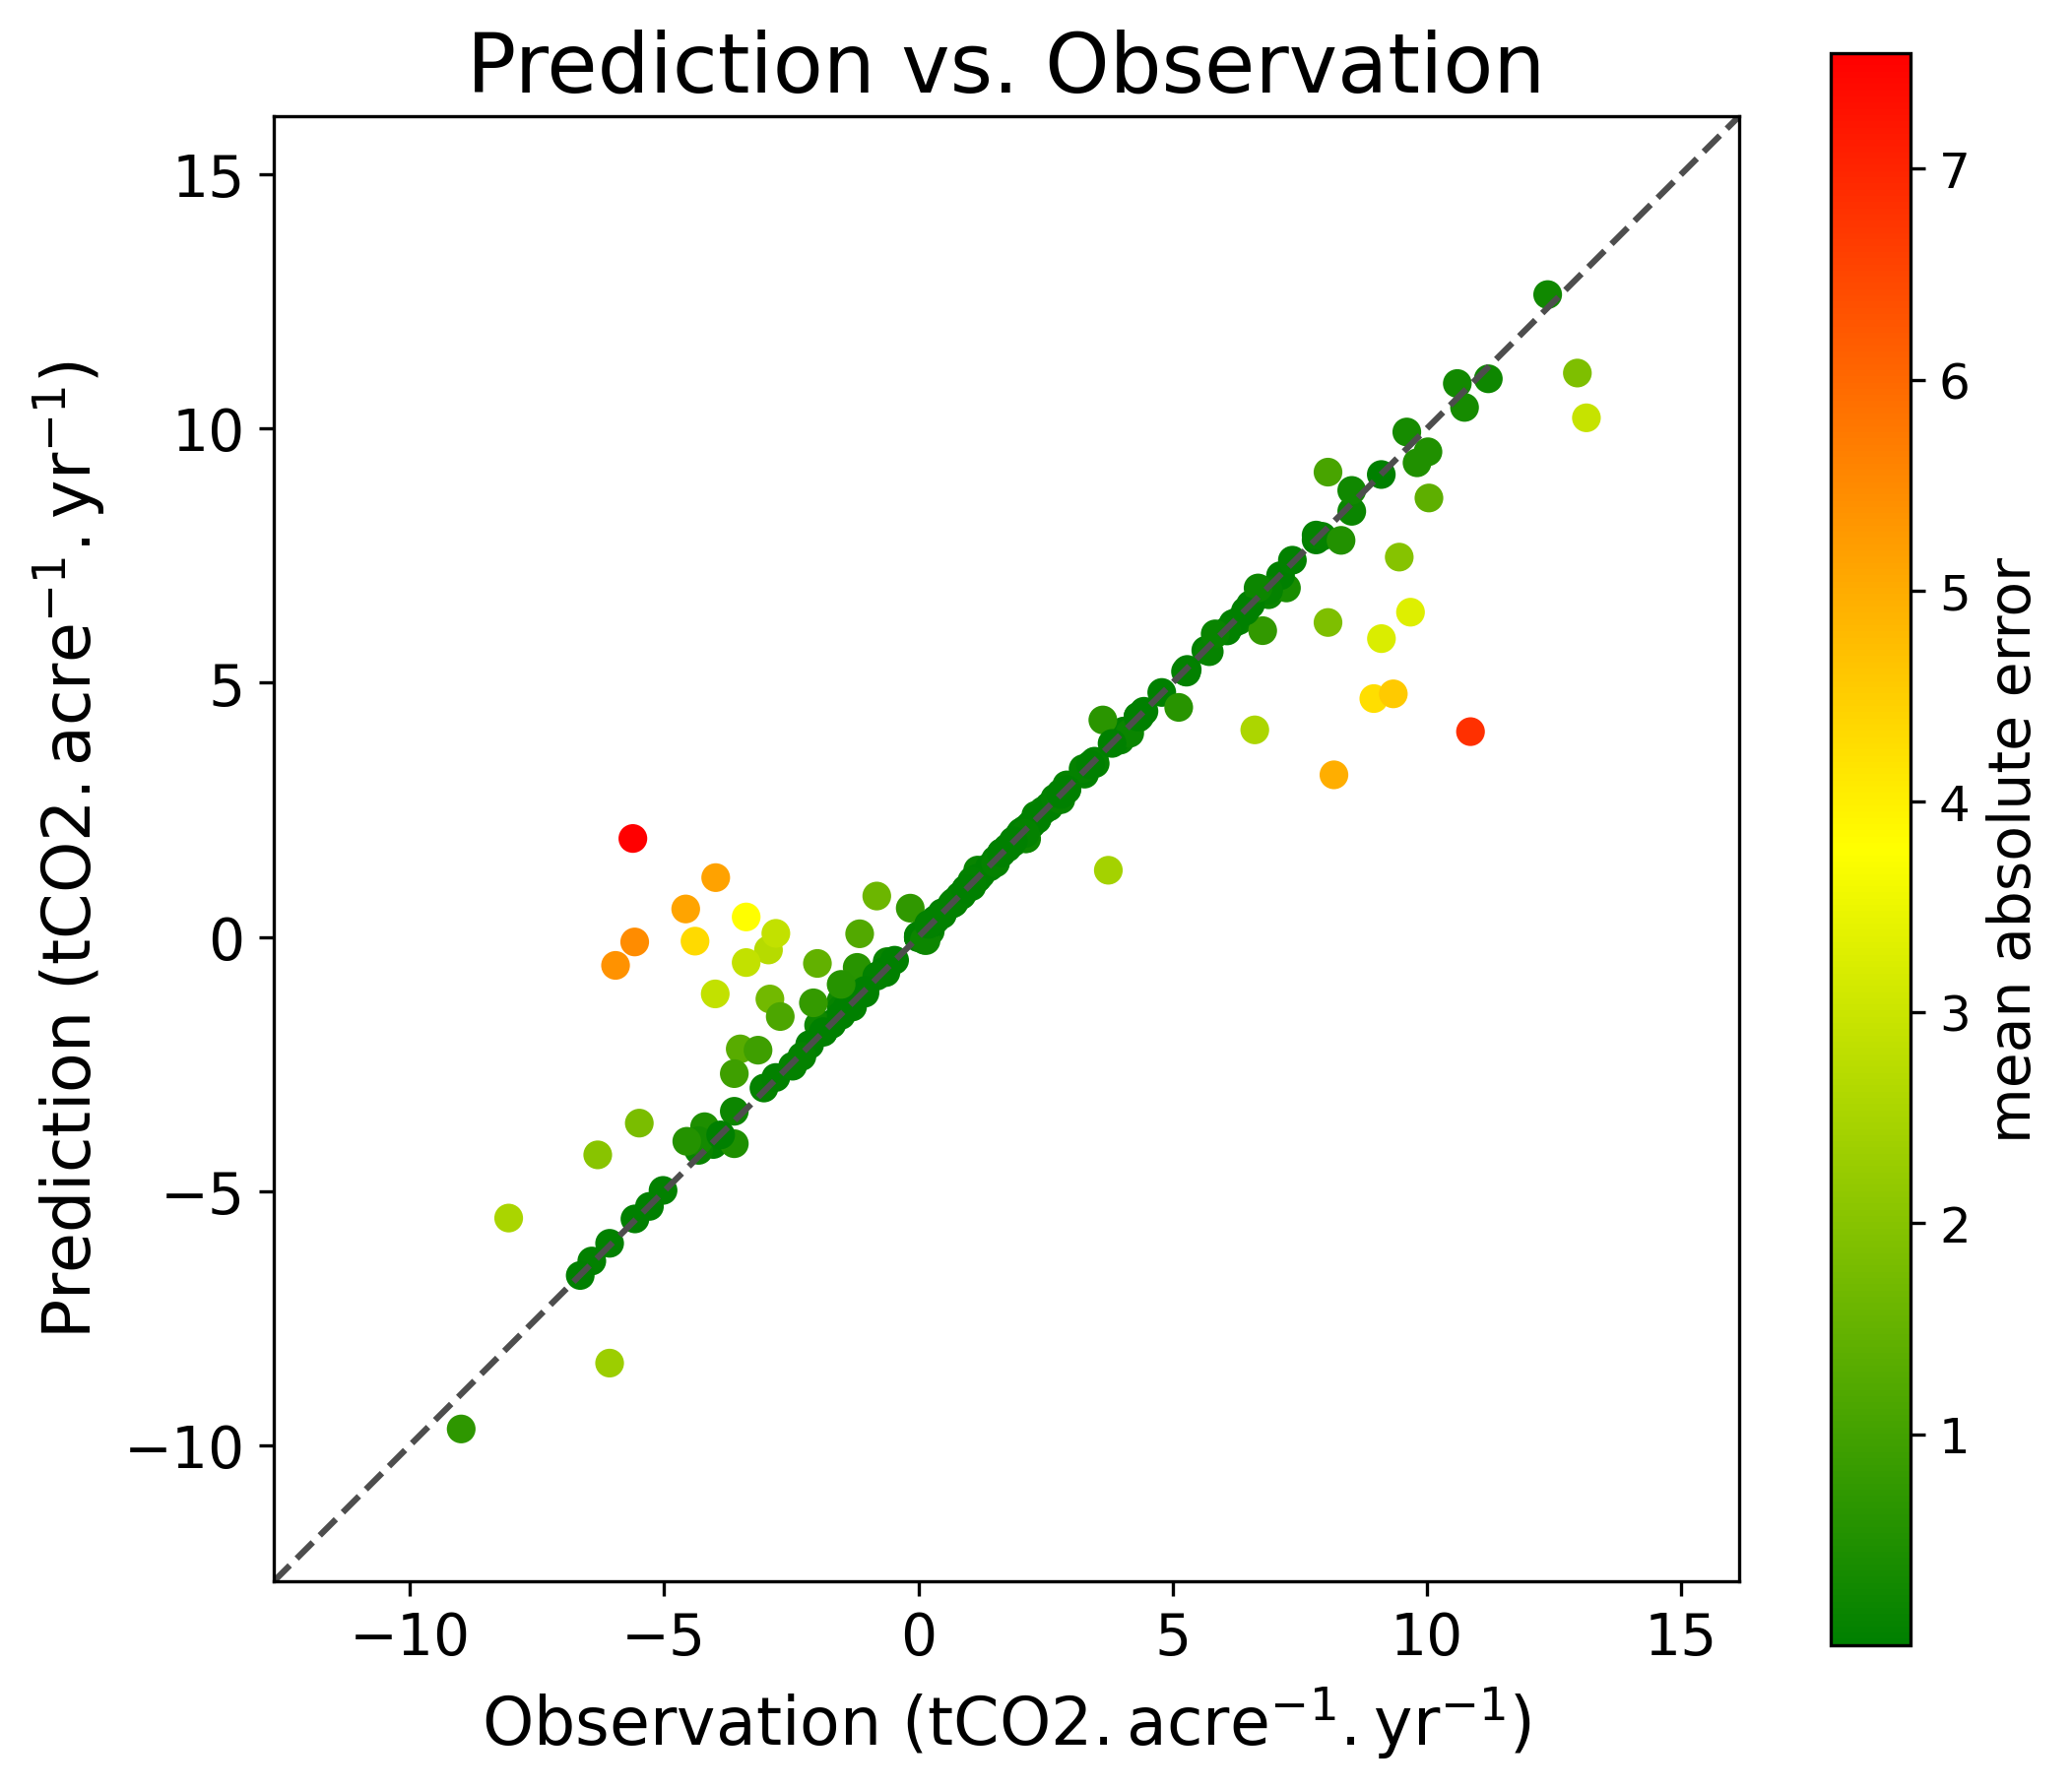
Our solution exploits the latest advances in multi-spectral satellite imaging and deep learning technology to select where to collect soil samples to efficiently capture the variation in carbon concentrations throughout an agricultural field. We use that data to train deep learning models that predict changes in soil carbon. Our solution cuts the “uncertainty deduction” by over 90%. We create custom carbon credit portfolios that match the level of certainty desired by the buyer, by using statistical analysis to allocate fields to a reserve and adjusting the reserve throughout the term of the contract. As a result, the credit buyers get the removal tons they pay for, and the farmers get the credit revenue they deserve.